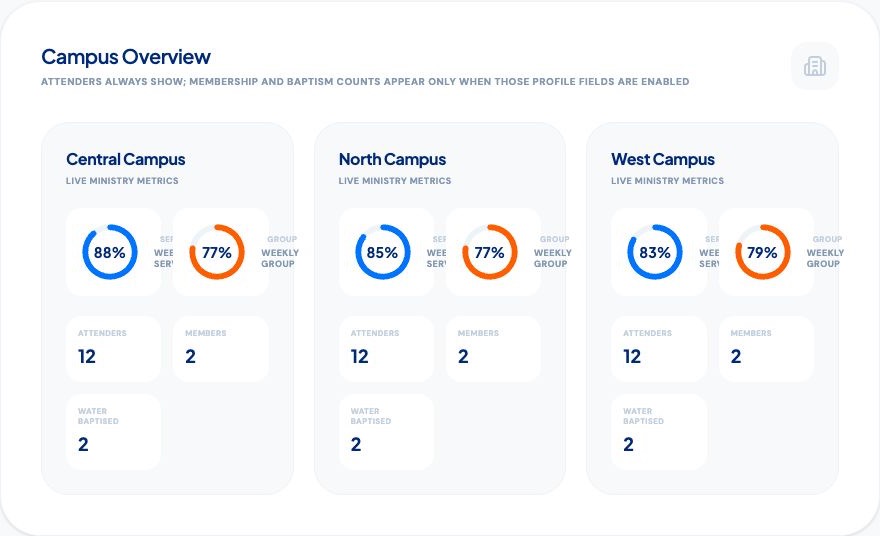
Church dashboards can give pastors and ministry leaders a clearer view of attendance, groups, leaders and care across the church. But a dashboard is only useful when it helps someone ask a better question or take a wiser next step.
A screen filled with totals may look impressive while hiding the people behind the numbers. Sunday attendance can rise while small group connection weakens. A campus can submit every report while leaders feel exhausted. A group can appear stable even as several people quietly stop attending.
The strongest church dashboard software brings several ministry signals together, preserves context and helps leaders notice changes early. It does not turn data into a verdict. It turns scattered information into better pastoral conversations.
What should a church dashboard actually do?
A church dashboard should answer recurring leadership questions without requiring staff to combine several spreadsheets before every meeting. It should show trends over time, allow leaders to compare appropriate levels of the organisation and make gaps visible.
For a growing or multi-campus church, useful dashboard questions include:
- Are more unique people becoming connected?
- Which attendance changes deserve a closer look?
- Which groups are healthy and which may need support?
- Are leaders maintaining sustainable care rhythms?
- Where are pastoral alerts or unresolved care needs increasing?
- Are reports missing because ministry paused or because the process broke down?
My12 provides church dashboards for leaders and pastors that connect these questions across organisations, campuses, groups and leaders.
1. Unique people, not only total attendance
Total attendance measures activity. Unique people measure reach. If the same 100 people attend four services in a month, monthly total attendance may show 400. That number is useful for planning, but it does not mean 400 people were connected.
A healthy dashboard allows leaders to view both. Total attendance can help with capacity and event comparison. Unique people can help leaders understand whether the church is reaching and retaining more individuals.
This distinction is especially important when comparing campuses or date ranges. Read more about turning church attendance tracking into follow-up.
2. Attendance trends across services and groups
One attendance number rarely explains church health. Sunday worship and small group participation show different kinds of connection. A person may attend services regularly without belonging to a group, while another may be deeply connected to a group but temporarily absent on Sundays.
A useful church attendance dashboard shows patterns across both rhythms. Leaders can compare recent weeks with a longer period and look for sustained movement rather than reacting to one unusual Sunday.
Seasonality, holidays, weather, venue changes and special events all matter. The dashboard should provide a starting point for interpretation, not pretend that every change has the same cause.
3. Small group health and reporting rhythm
Small groups are often where people become known, receive prayer and experience consistent follow-up. A church dashboard should therefore show more than the number of active groups.
Useful group signals include unique people connected, attendance rhythm, missing meeting reports, changes over time and whether leaders are receiving support. For churches with courses and short-term events, the system should separate ongoing small groups from other group events so the statistics remain meaningful.
My12 connects these insights with its small group management software workflow.
4. Leader care rhythm
Church health depends partly on the health and support of its leaders. A dashboard should help senior leaders notice when care rhythms are weakening without treating volunteers like employees under surveillance.
Leader signals may include recent activity, overdue reports, people needing follow-up, feedback and the number of active care situations. A drop in activity may reflect holiday, illness, a paused group, technical difficulty or overload. The right response is usually a conversation.
Good church dashboards make it easier to ask, "How can we support this leader?" rather than, "Why is this number low?"
5. Open care needs and pastoral alerts
Attendance tells only part of the story. Leaders may also raise concerns, create care actions or request senior pastoral support. A church health dashboard should show whether care needs are open, acknowledged and receiving appropriate attention.
A church care alert can help serious needs become visible earlier. The dashboard should show the existence and status of the concern to authorised leaders without exposing unnecessary sensitive detail in a broad analytics view.
This is where role-based access matters. Senior visibility should be purposeful and proportionate.
6. Prayer, answered prayer and meaningful life moments
Church dashboards should not only display problems. Healthy ministry also includes answered prayer, praise reports, baptism, serving, group connection and other meaningful moments in a person's life journey.
These signals help leadership teams see where care and discipleship are bearing fruit. They also keep church health from becoming a story told only through attendance decline and unresolved tasks.
Not every prayer request belongs in an organisation-wide chart. The dashboard can show appropriate counts and trends while detailed pastoral context remains limited to the right roles.
7. Campus comparison with context
Multi-campus churches need a shared view across locations, but comparison can become unhealthy when campuses have different ages, capacities, communities and ministry models.
A campus dashboard should use consistent definitions for attendance, groups and people while allowing leaders to understand local context. The purpose is to learn and support, not create a simplistic ranking table.
Useful comparisons include reporting consistency, attendance trend, unique people, group connection and care signals. Leaders should be able to move from organisation overview to campus detail when a pattern needs explanation.
8. Feedback from leaders
Numbers cannot explain everything. Short leader feedback and pulse checks can show whether ministry feels sustainable, where leaders need training and what is changing beneath the surface.
Combining quantitative signals with leader feedback gives pastors a more balanced picture. A campus may show strong attendance while leaders report pressure. Another may show modest growth alongside healthy team development and consistent care.
A church dashboard should create room for both realities.
Church dashboard metrics to treat carefully
Some metrics become misleading when displayed without definition or context:
- total attendance without unique people;
- percentage changes based on very small numbers;
- group counts without active status or attendance;
- leader activity used as a performance score;
- care counts without privacy boundaries;
- campus rankings that ignore capacity and local context;
- one-week changes presented as long-term trends.
Every important number should have a clear definition. Leaders should know the date range, source and exclusions before making decisions from it.
How to evaluate church dashboard software
During a trial, ask the platform to answer real questions from your leadership meetings:
- Can we see unique people and total attendance?
- Can we compare service and group rhythms?
- Can we move from organisation to campus, group and leader context?
- Can we distinguish missing data from declining attendance?
- Are sensitive pastoral details protected?
- Can leaders understand the dashboard without an analyst?
- Does the information lead to clear ministry questions?
- Can the system connect to church records we already use?
A beautiful dashboard that cannot answer those questions will soon become background decoration.
How My12 approaches church dashboards
My12 brings attendance, groups, campuses, leaders, care rhythm, alerts and feedback into a shared people-health view. Senior leaders can see patterns across the church, while leaders use a focused app for the people entrusted to them.
The aim is clarity without micromanagement. Data provides a signal, and ministry leaders provide the wisdom, context and human response. Explore all My12 church care and dashboard features.
The best church dashboards do not merely report what happened. They help leaders notice where support, celebration or follow-up may be needed next.